COVID-19 Local Tracker: Bringing Clear, Local COVID Data to Your Community
Background
While working to build a SaaS application for data collection and distillation, we decided to explore the possibility of using the technology to consume and display COVID data. At the time, COVID related dashboards were challenging to use and focused mostly on the national level. We wanted to develop something easy-to-use with a local focus.
Challenge
Rapidly developing a COVID data and news hub, centered on local, that was easily understood to a wide audience.
Research
I visited the current COVID dashboards and resources to see where improvements could be made to better serve a wider audience. In addition, a small survey was used to build a general framework and list of desired abilities.
Most Requested Features
Display local COVID data next to state and national
Easily understood chart to see current trend
Local COVID news section
Site speed
Map of selected area
Design Goals
To build a local COVID data and news hub featuring an easy-to-use interface with a focus on site speed. The information had to be presented quickly and in an appealing and approachable manner.
Process
PRODUCT BRAINSTORMING
The initial sketch focused on how to present each section and in-turn what technologies would power them. I roughed out the search process and the data presentation. A card sorting session paired with a survey helped identify the core of the product.
WIREFRAMES & SITE EVOLUTION
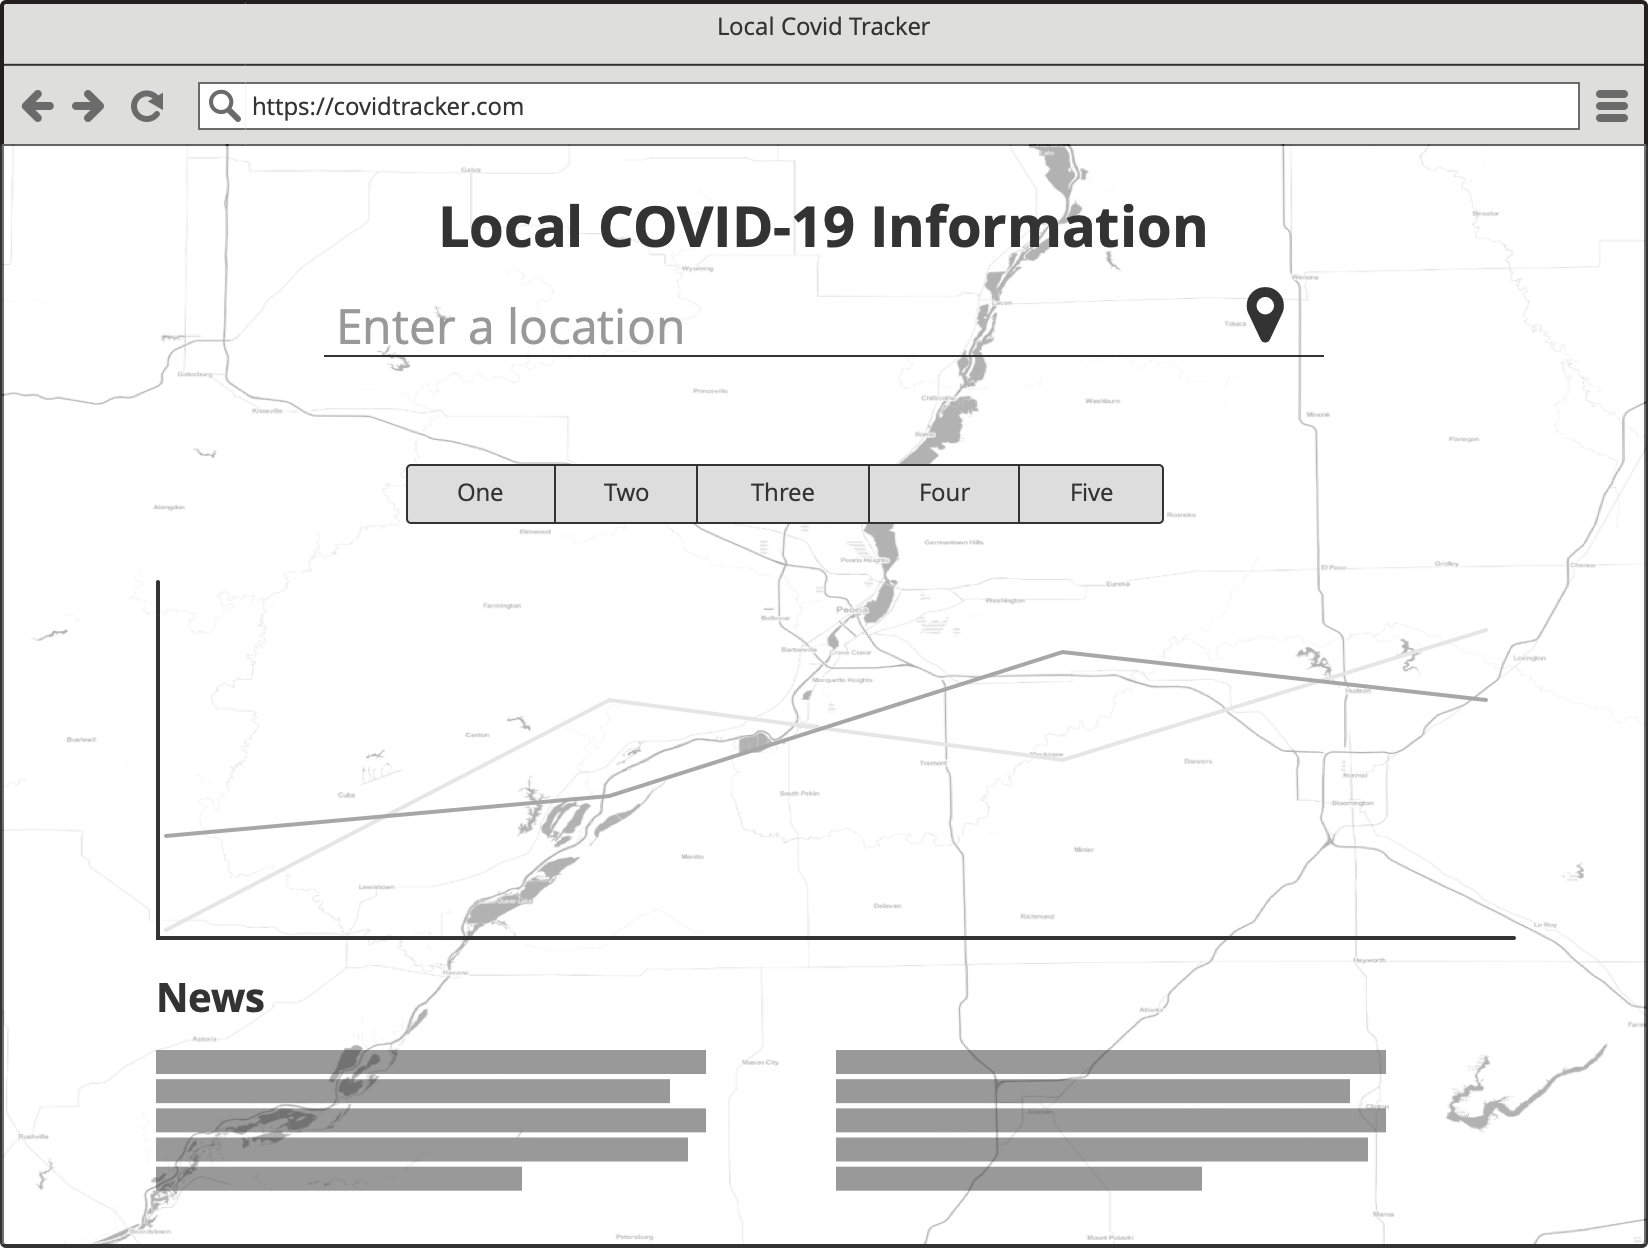
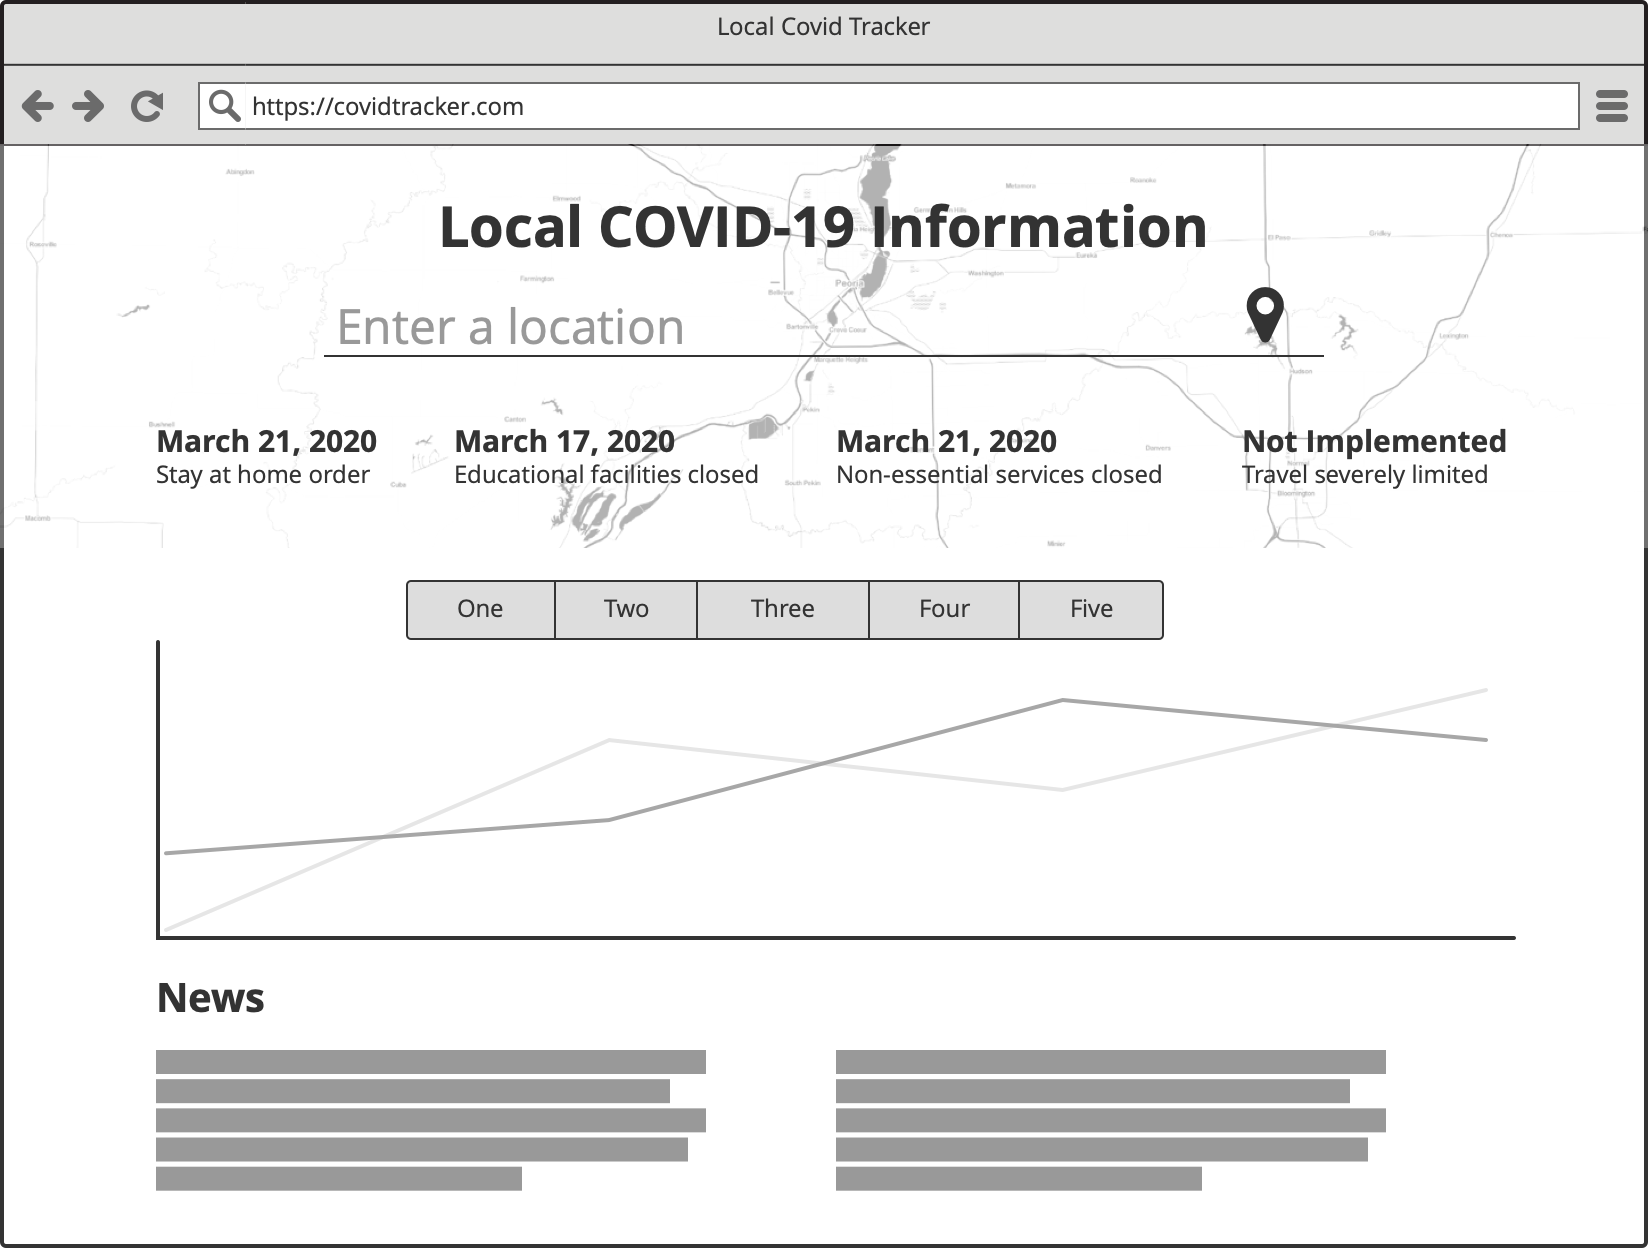
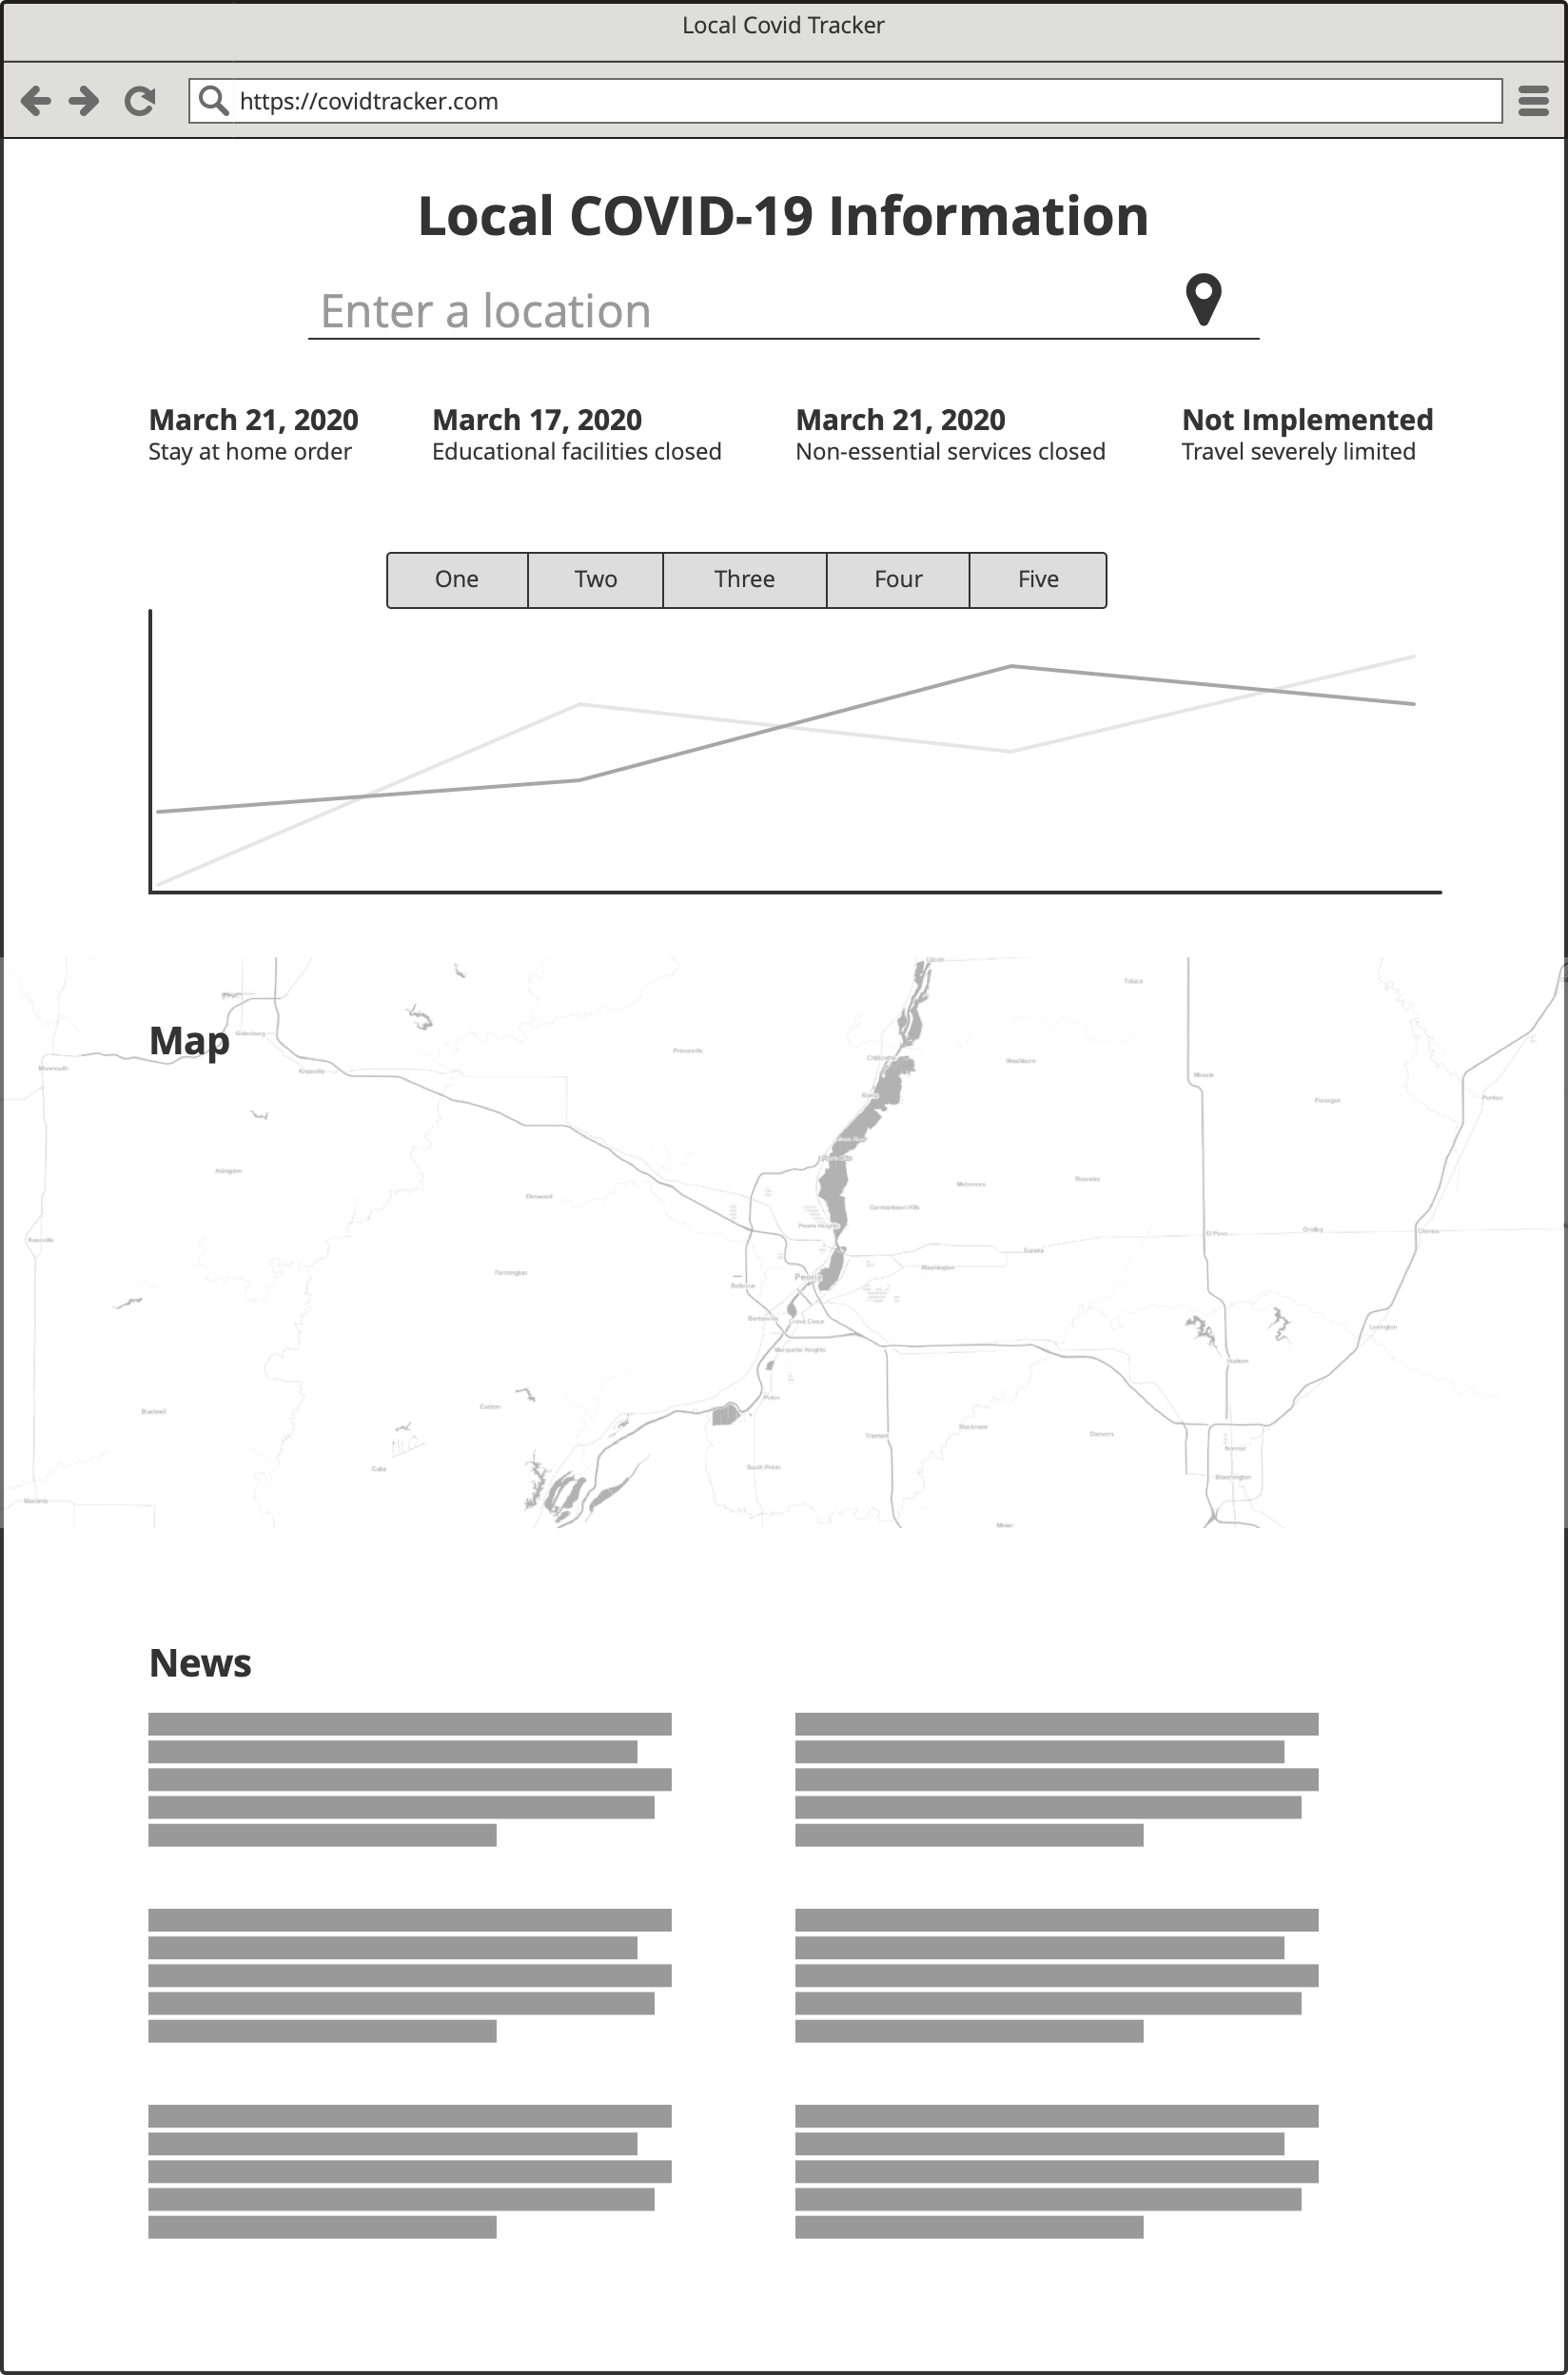
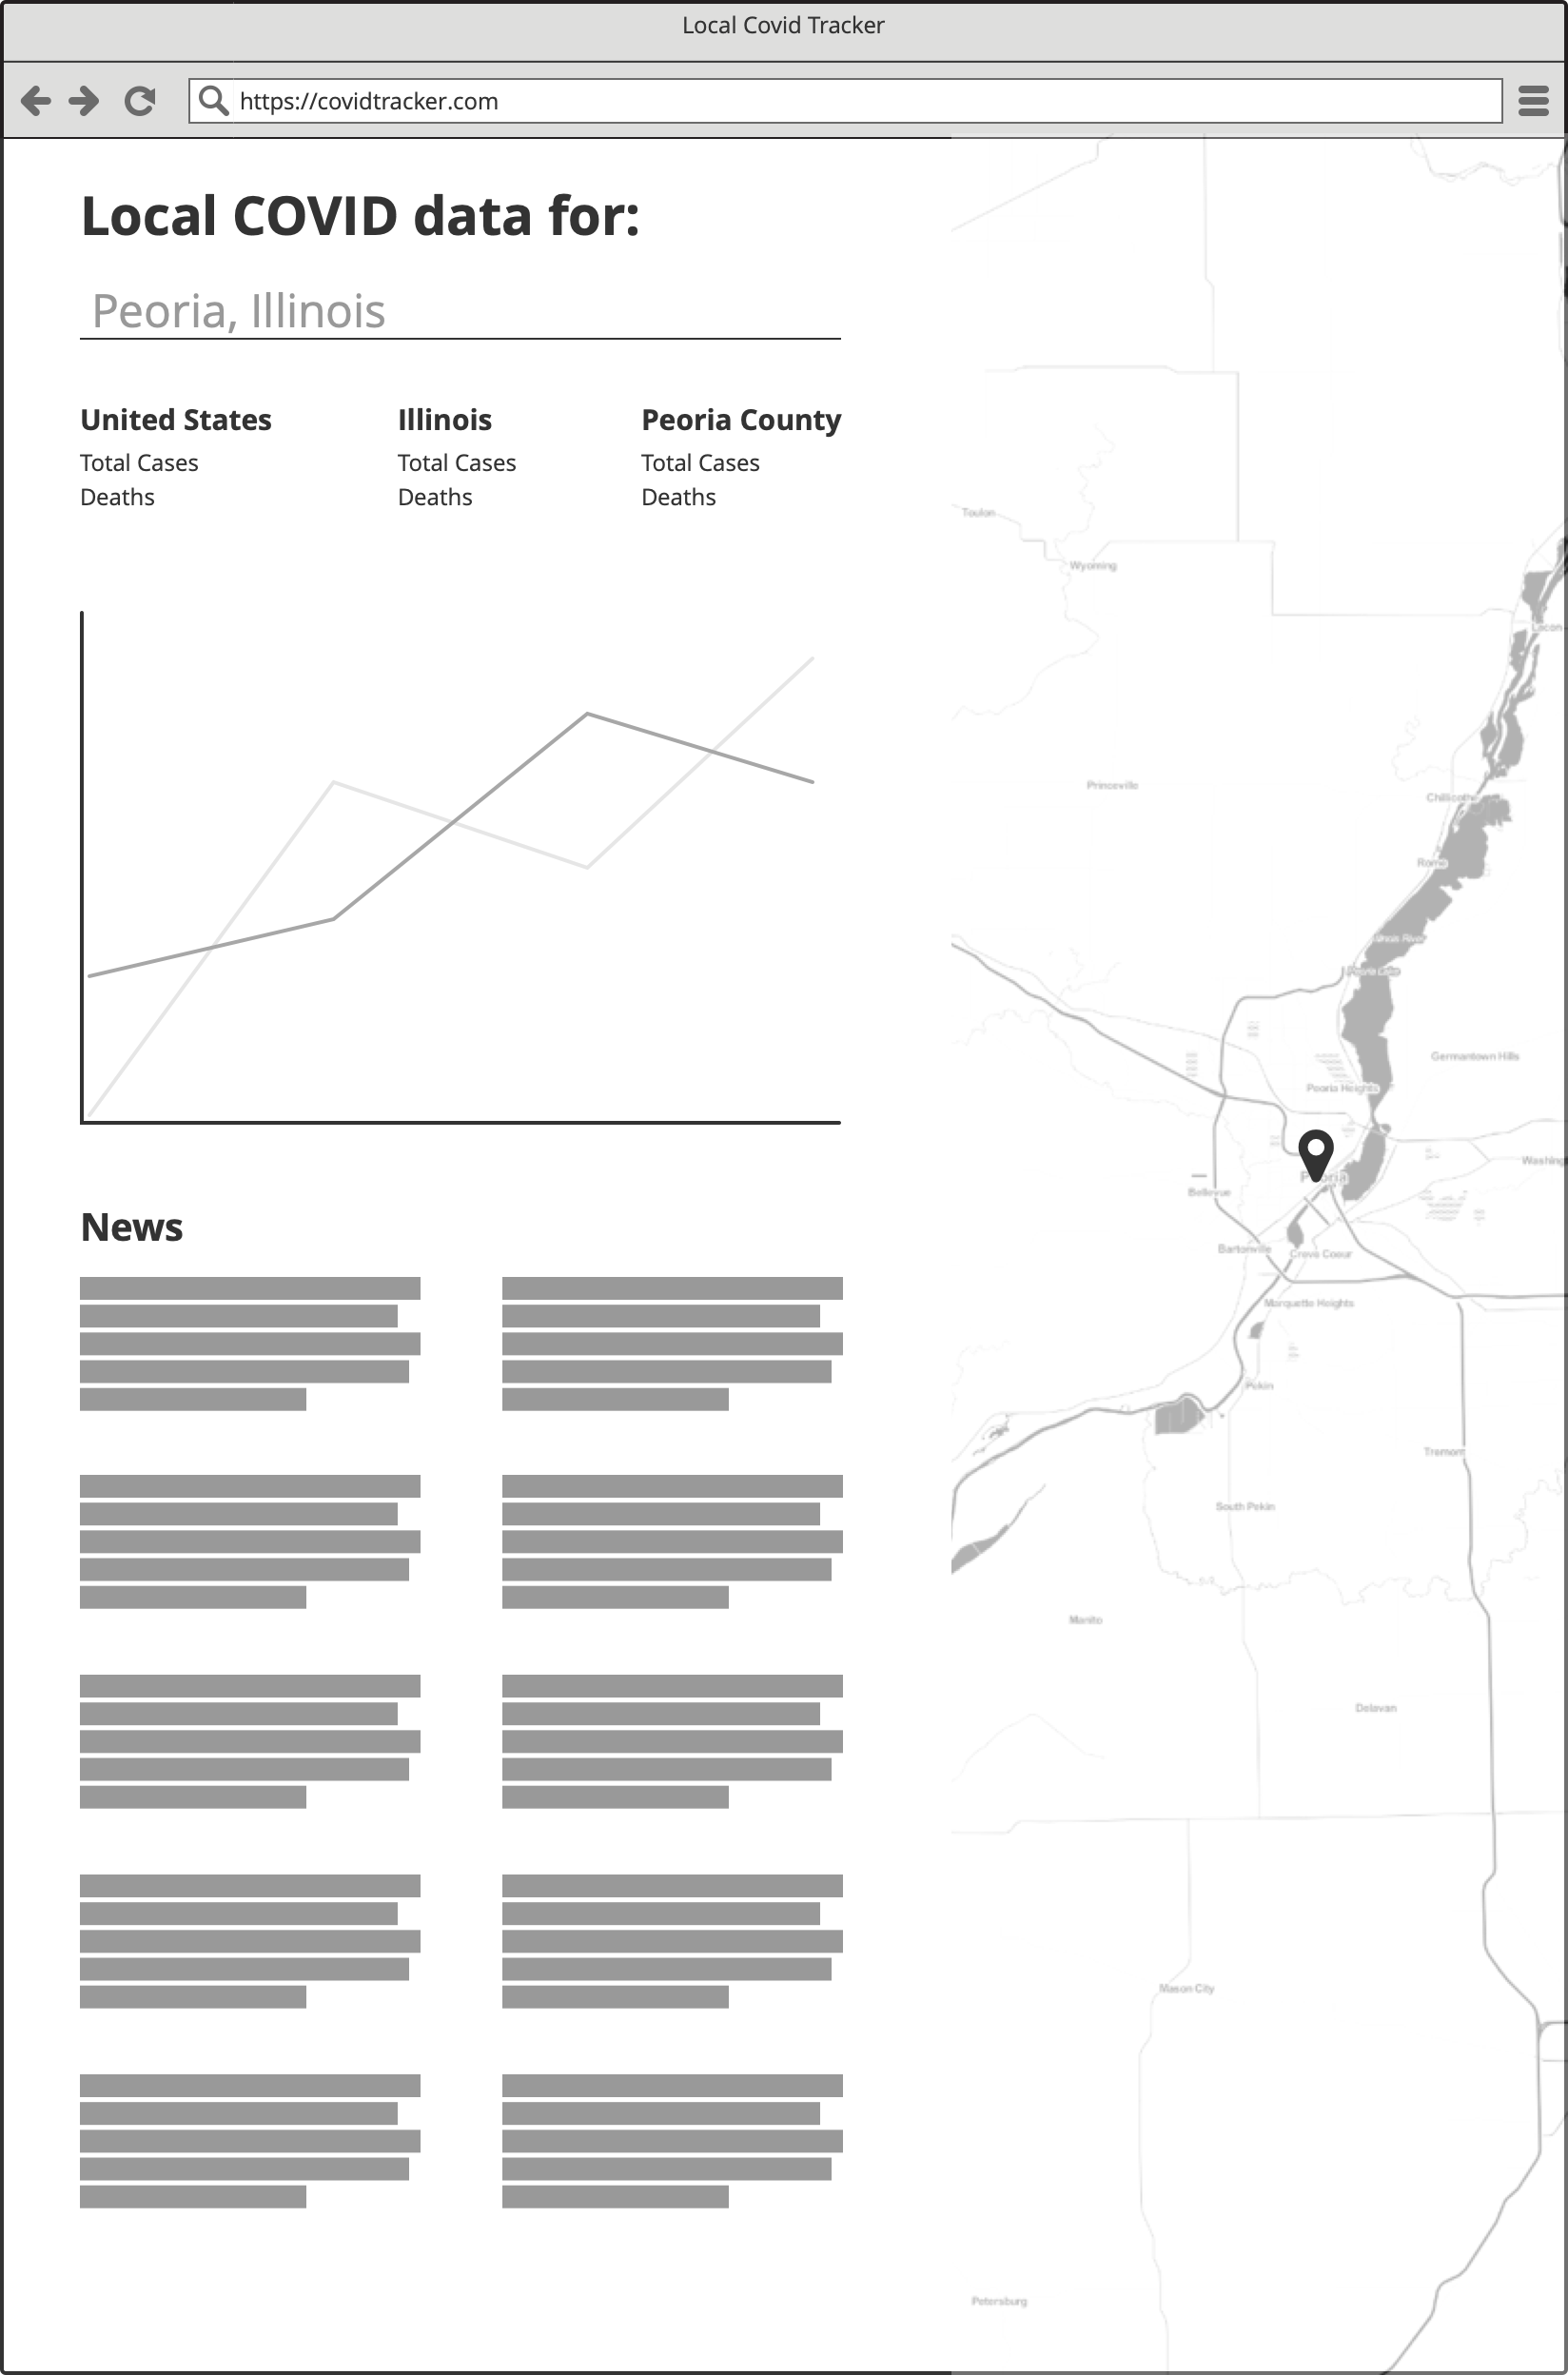
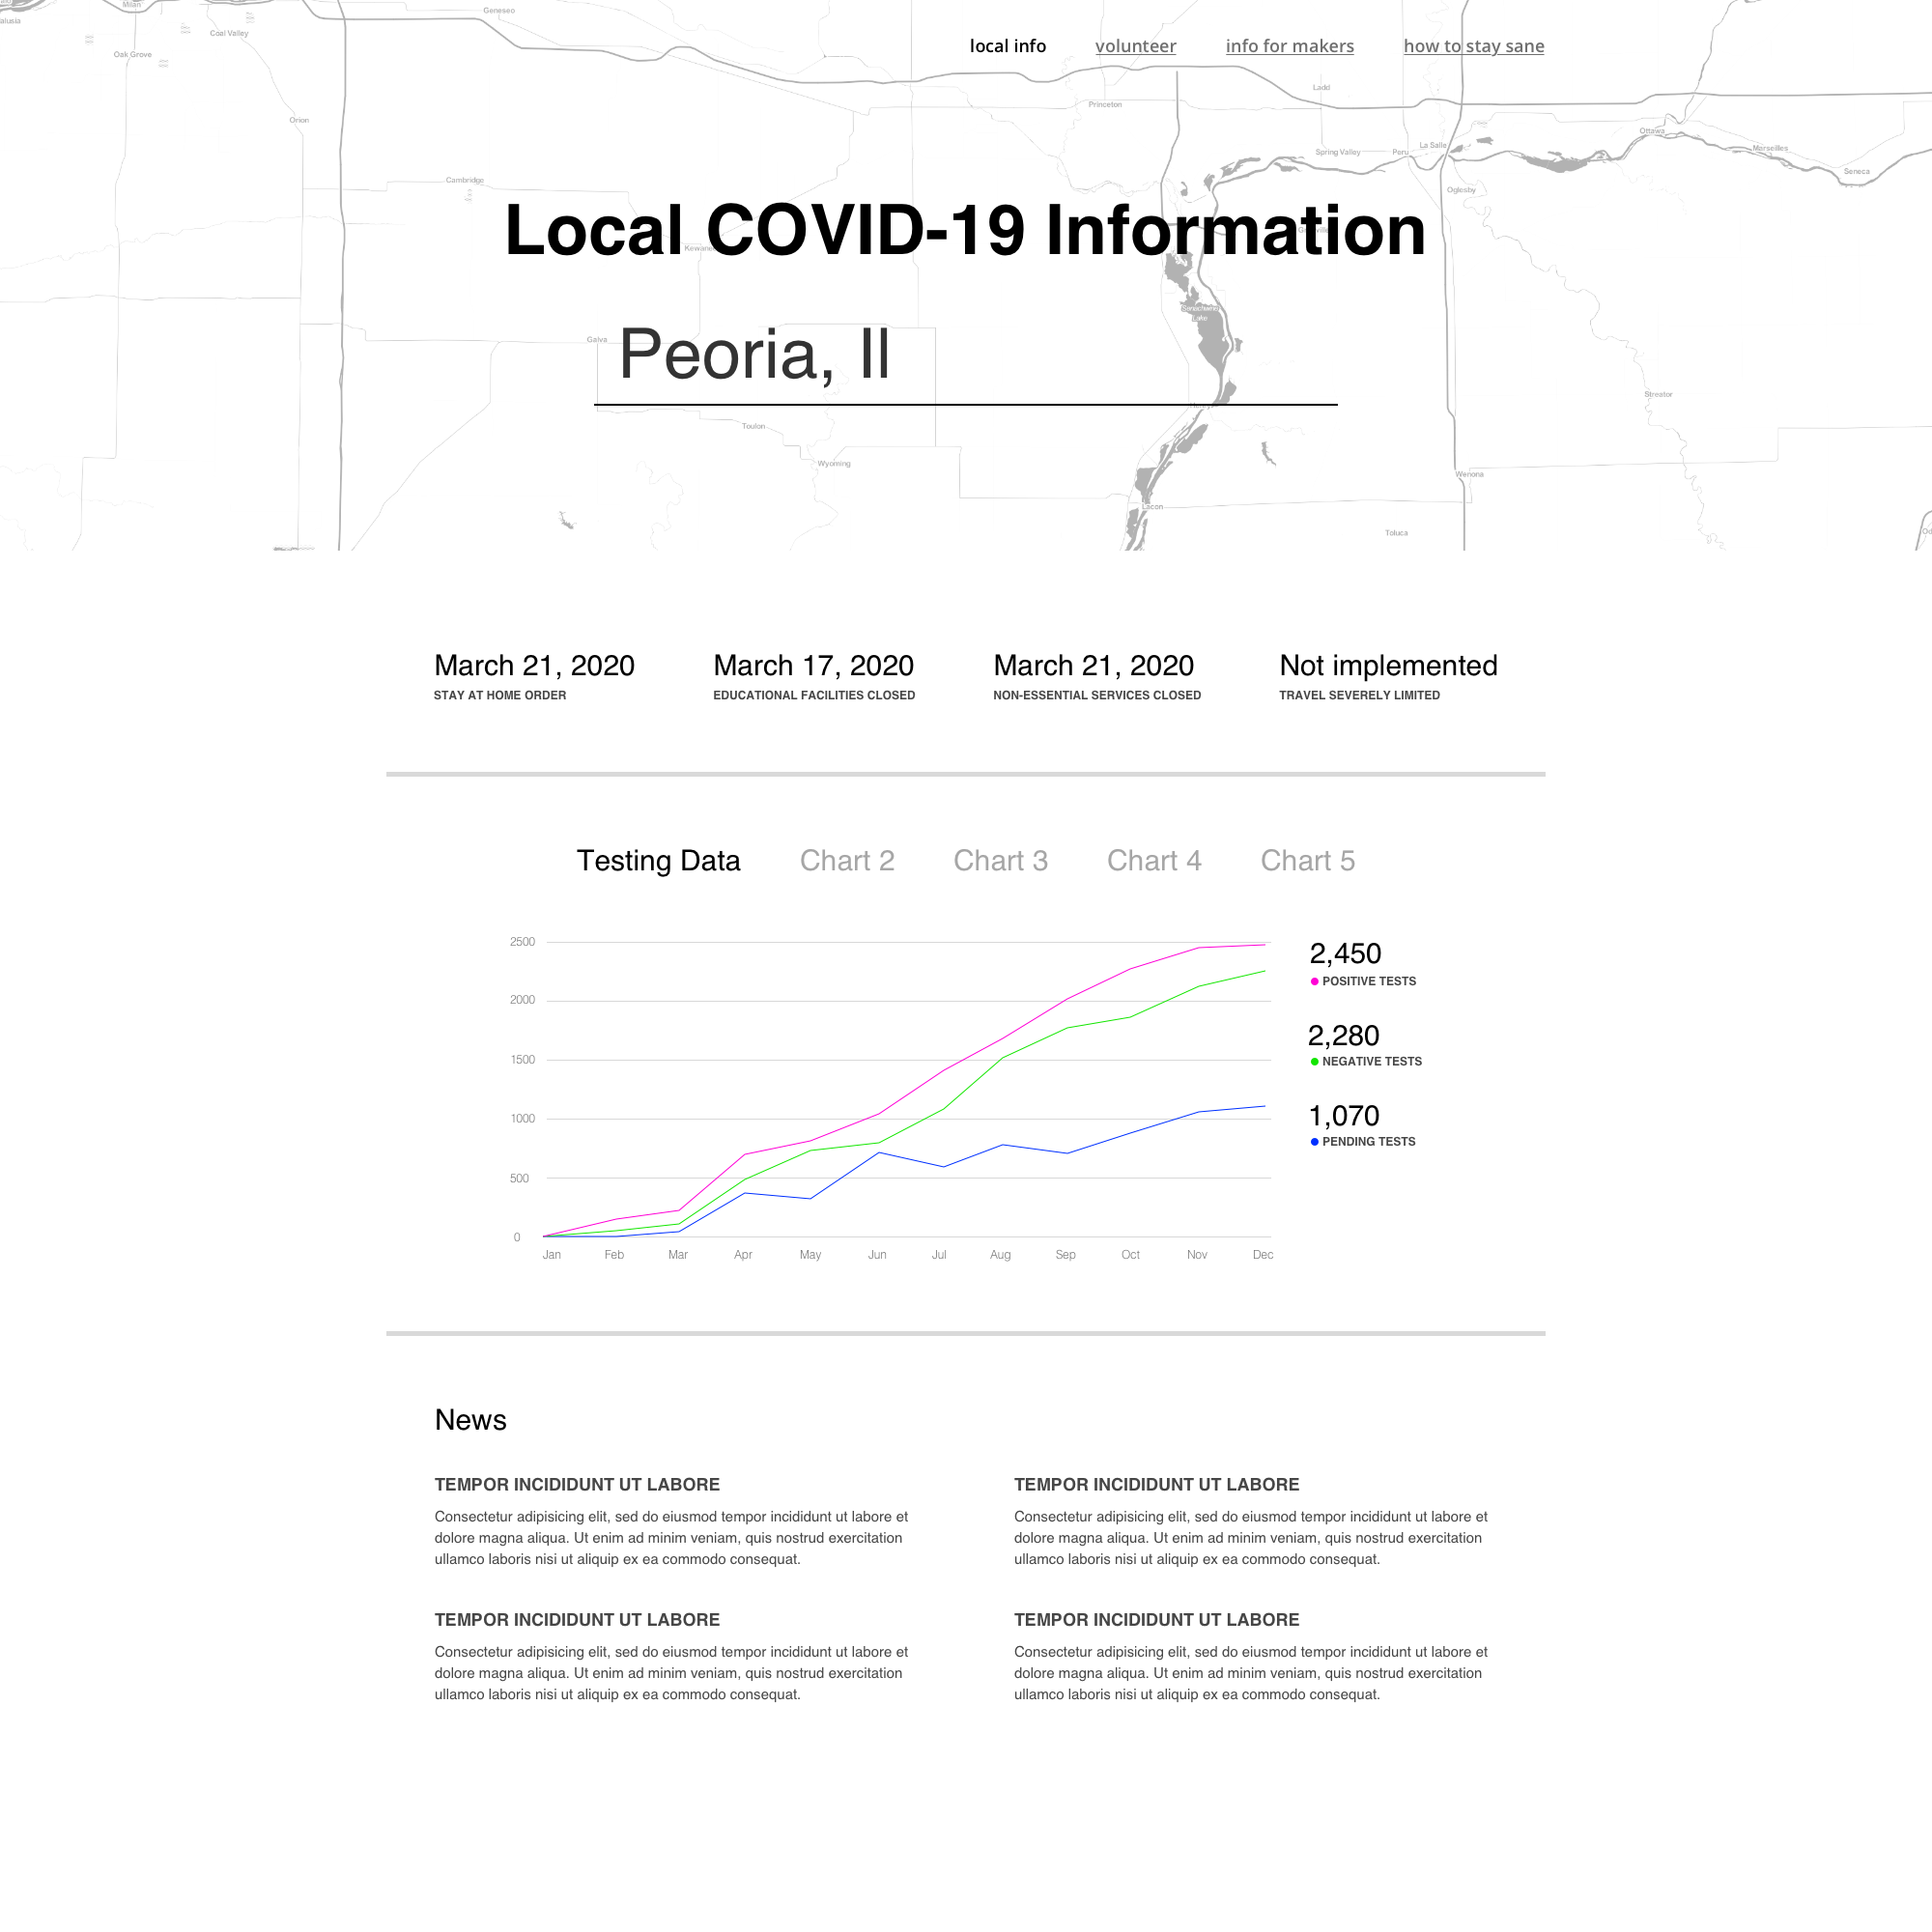
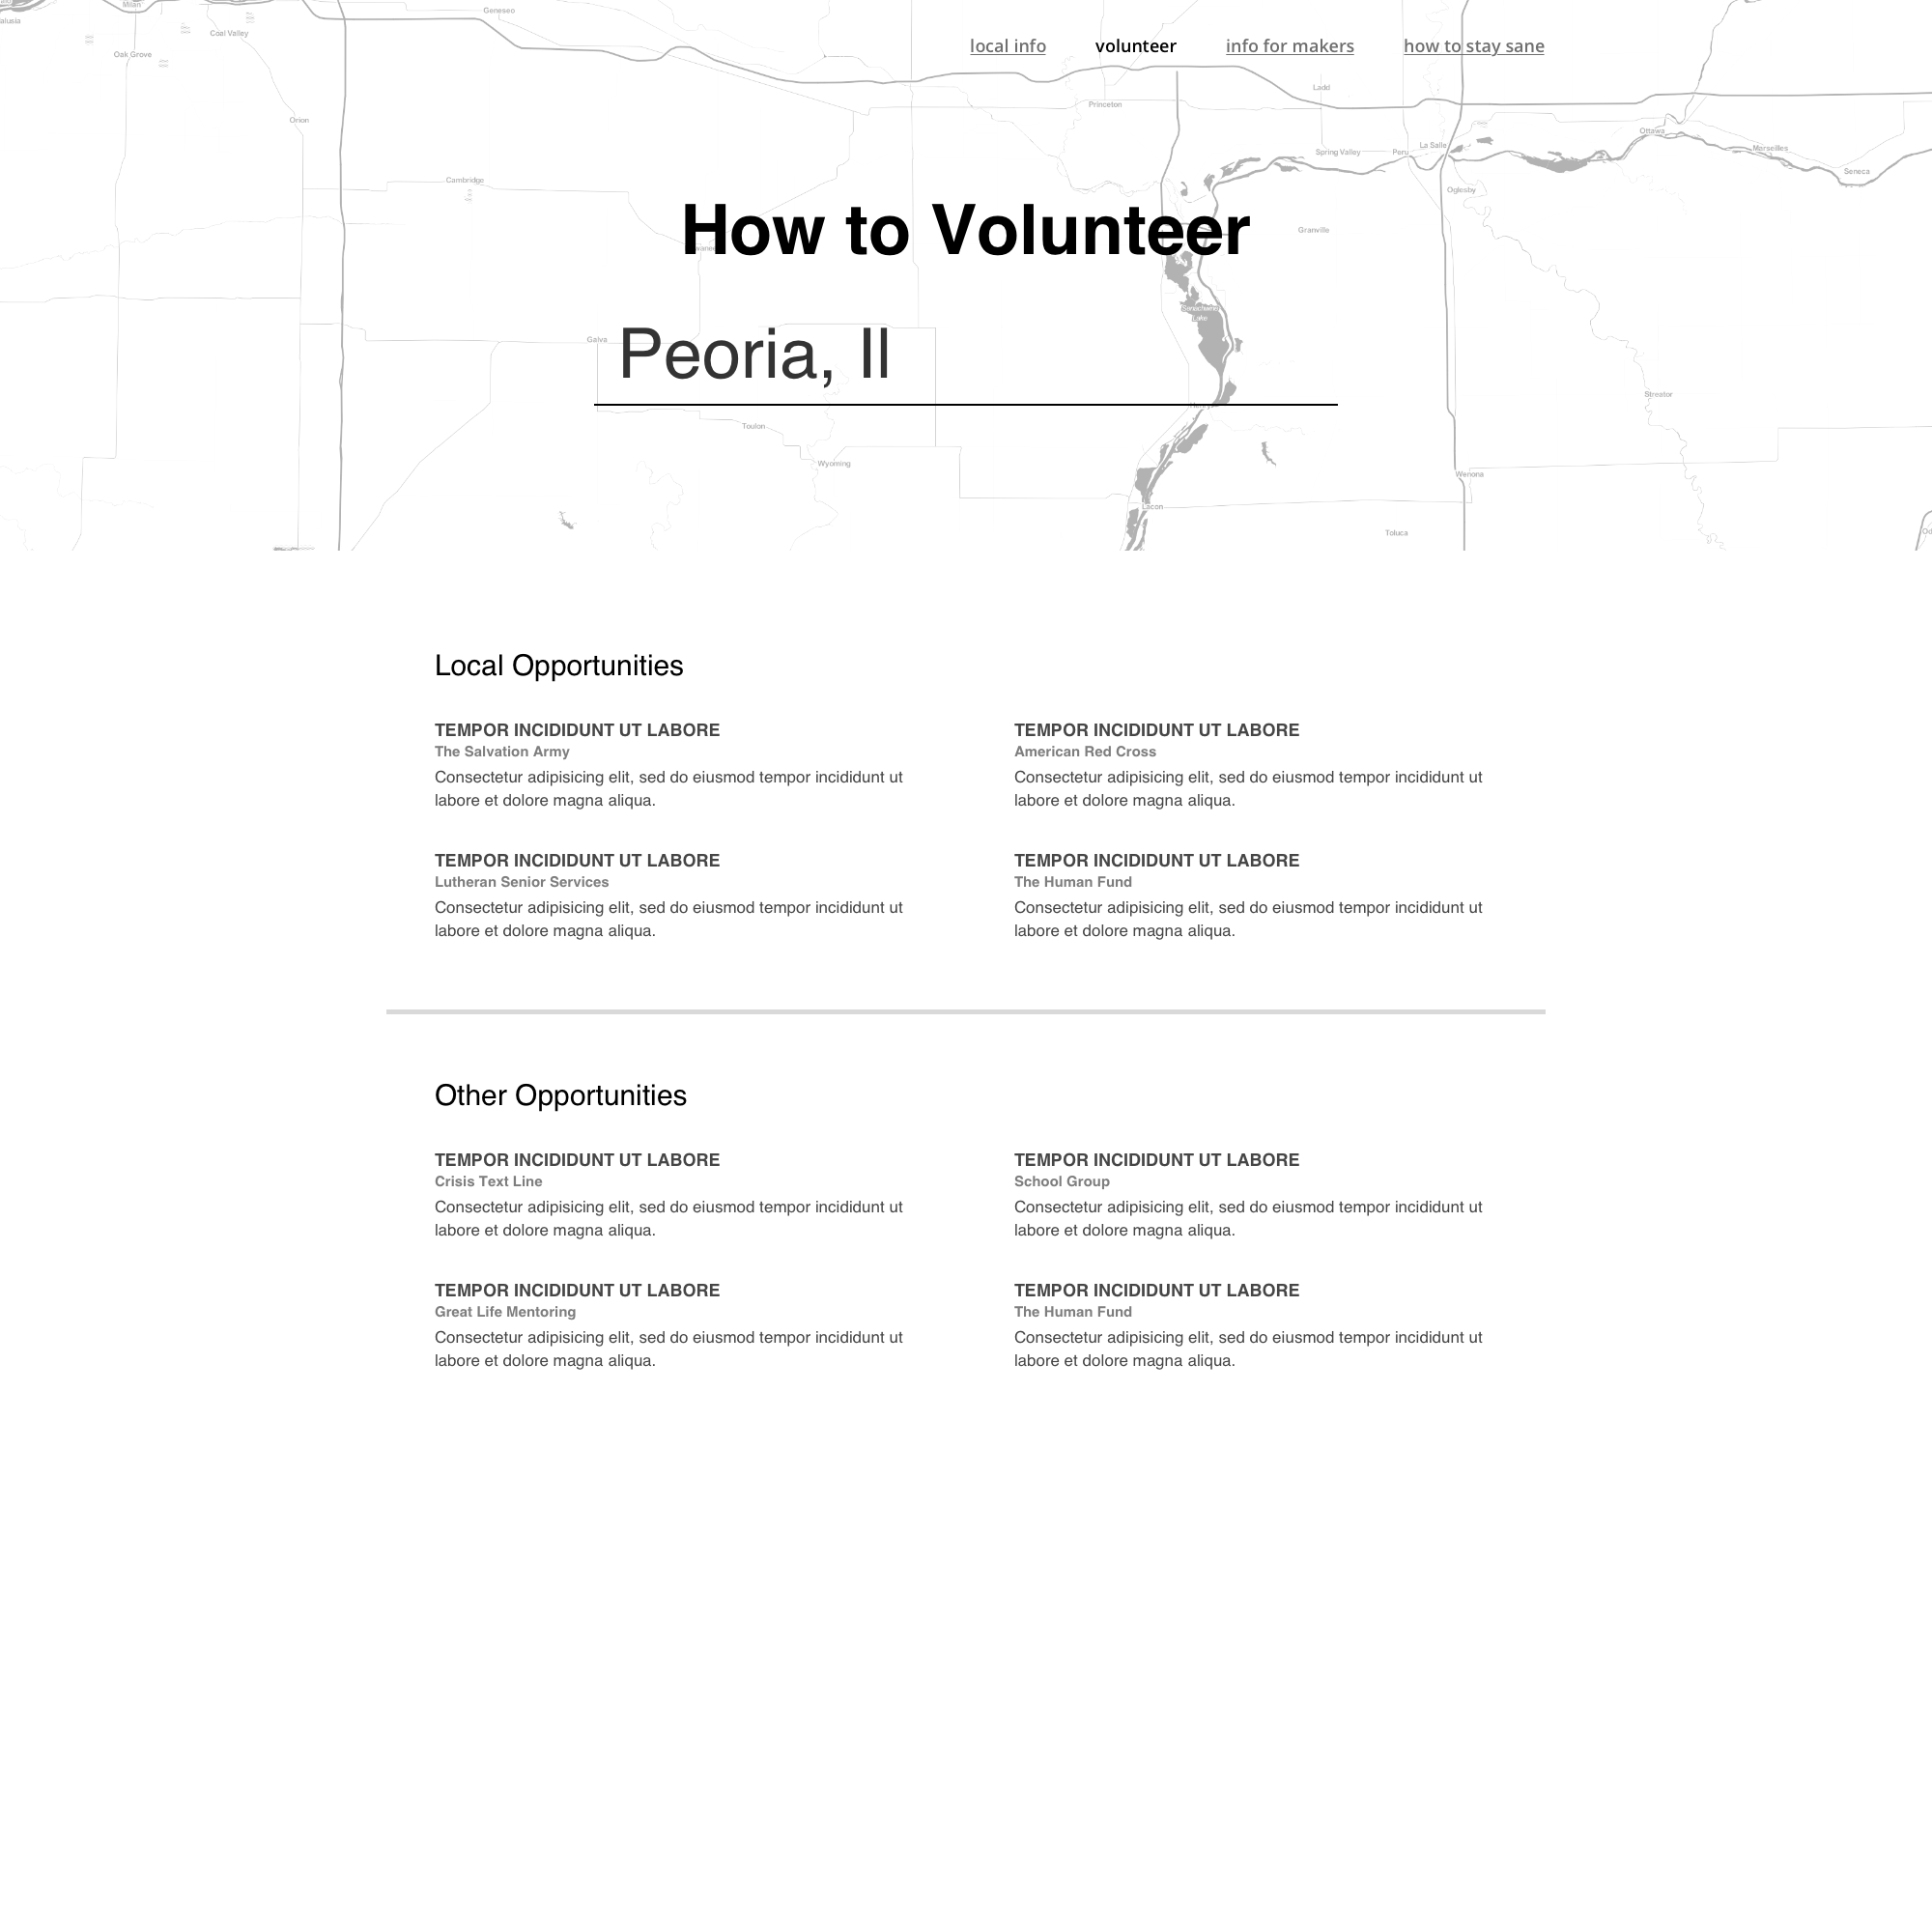
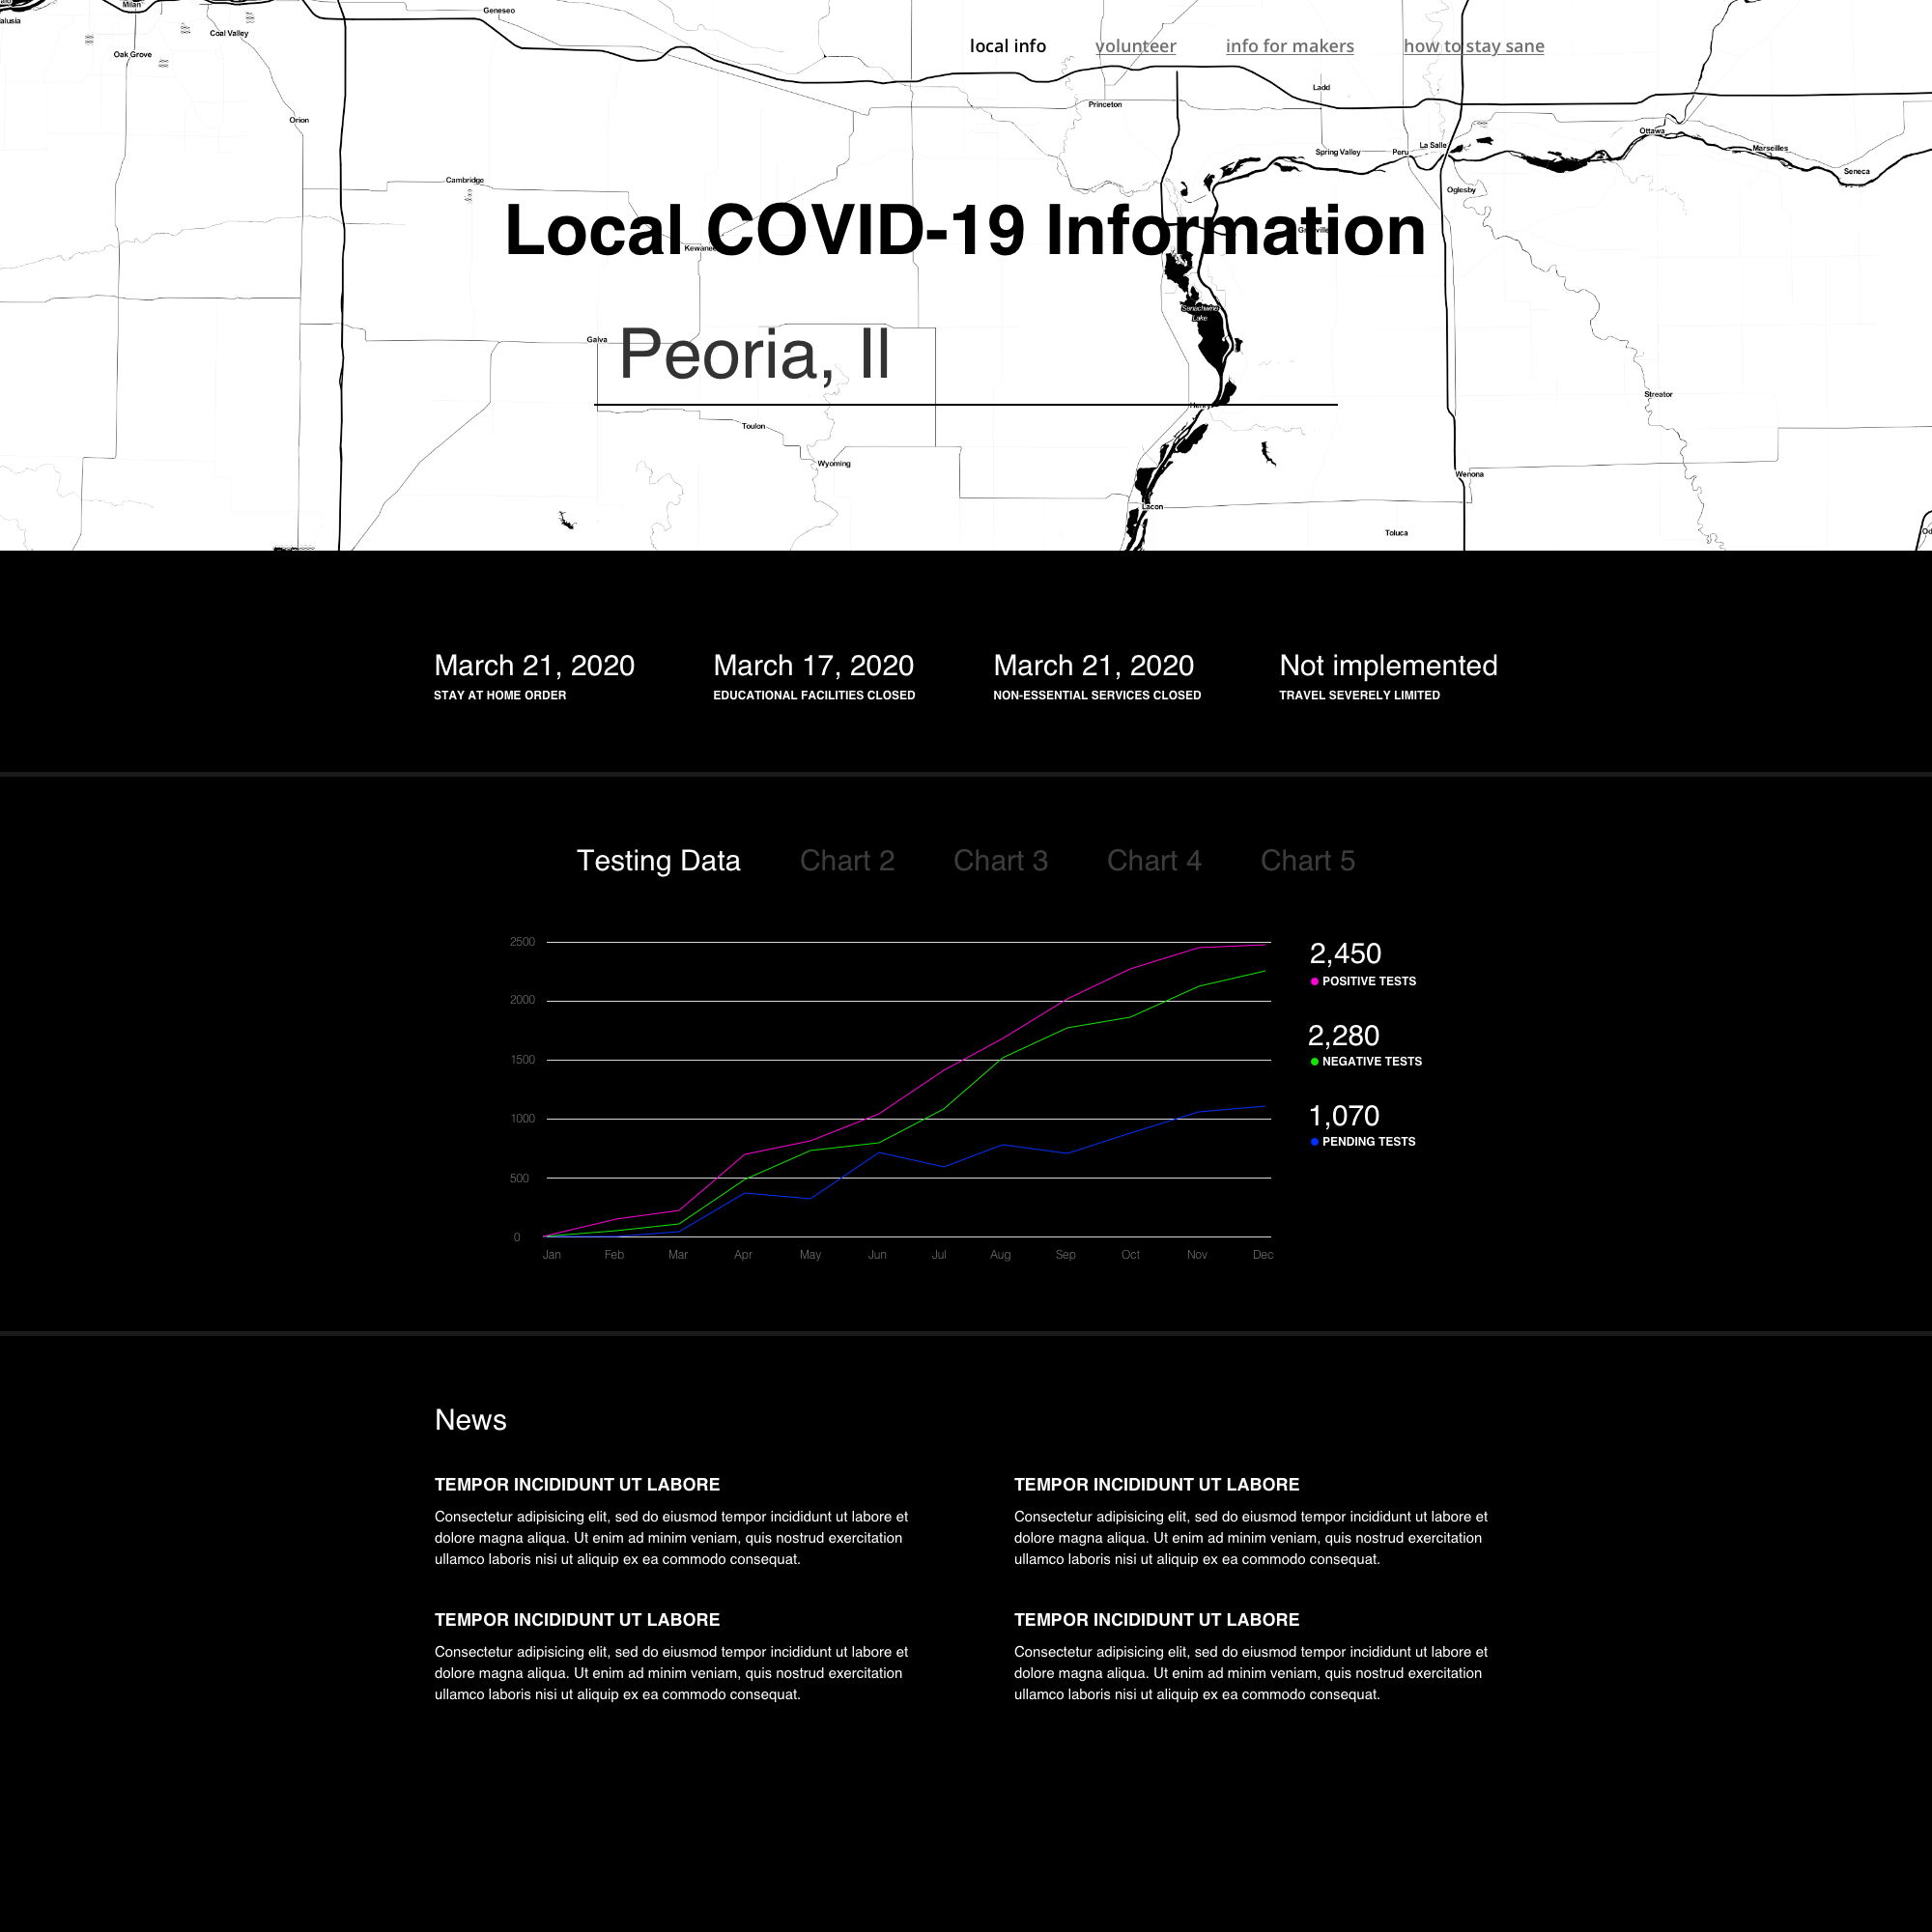
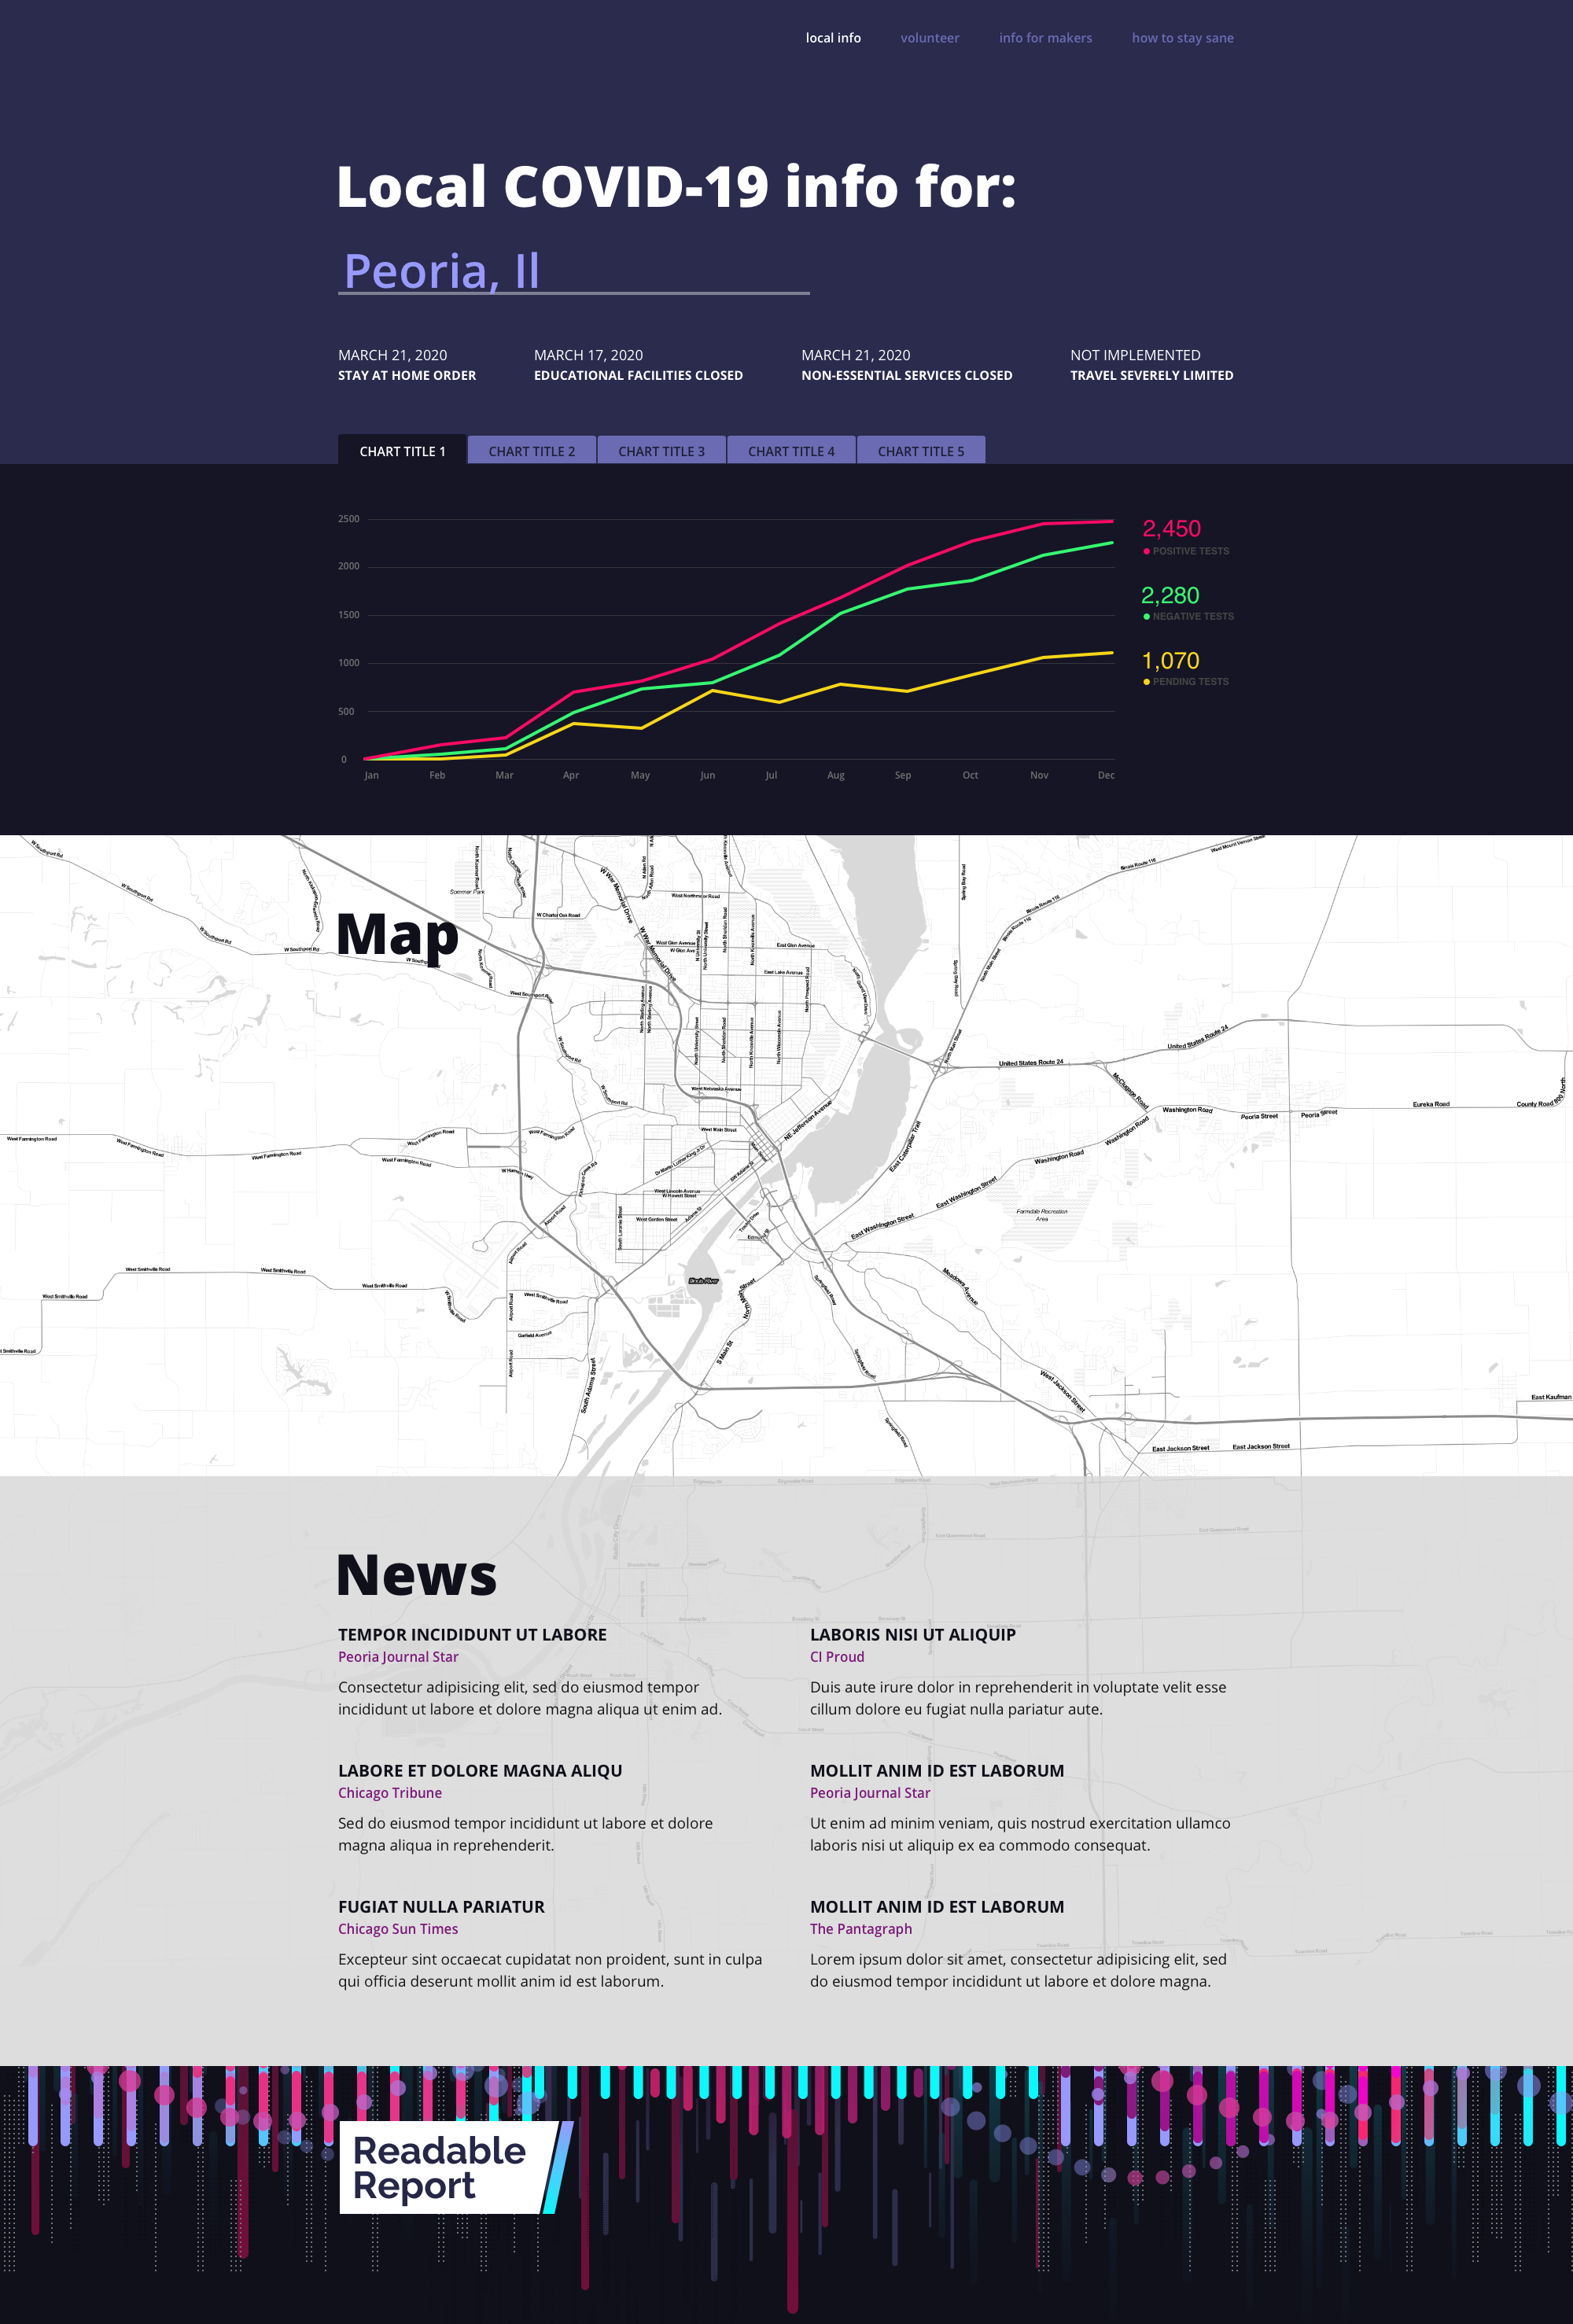
Here are the wireframes detailing the settled upon features. The search bar and results reside on the same page allowing for a quicker look-up experience.
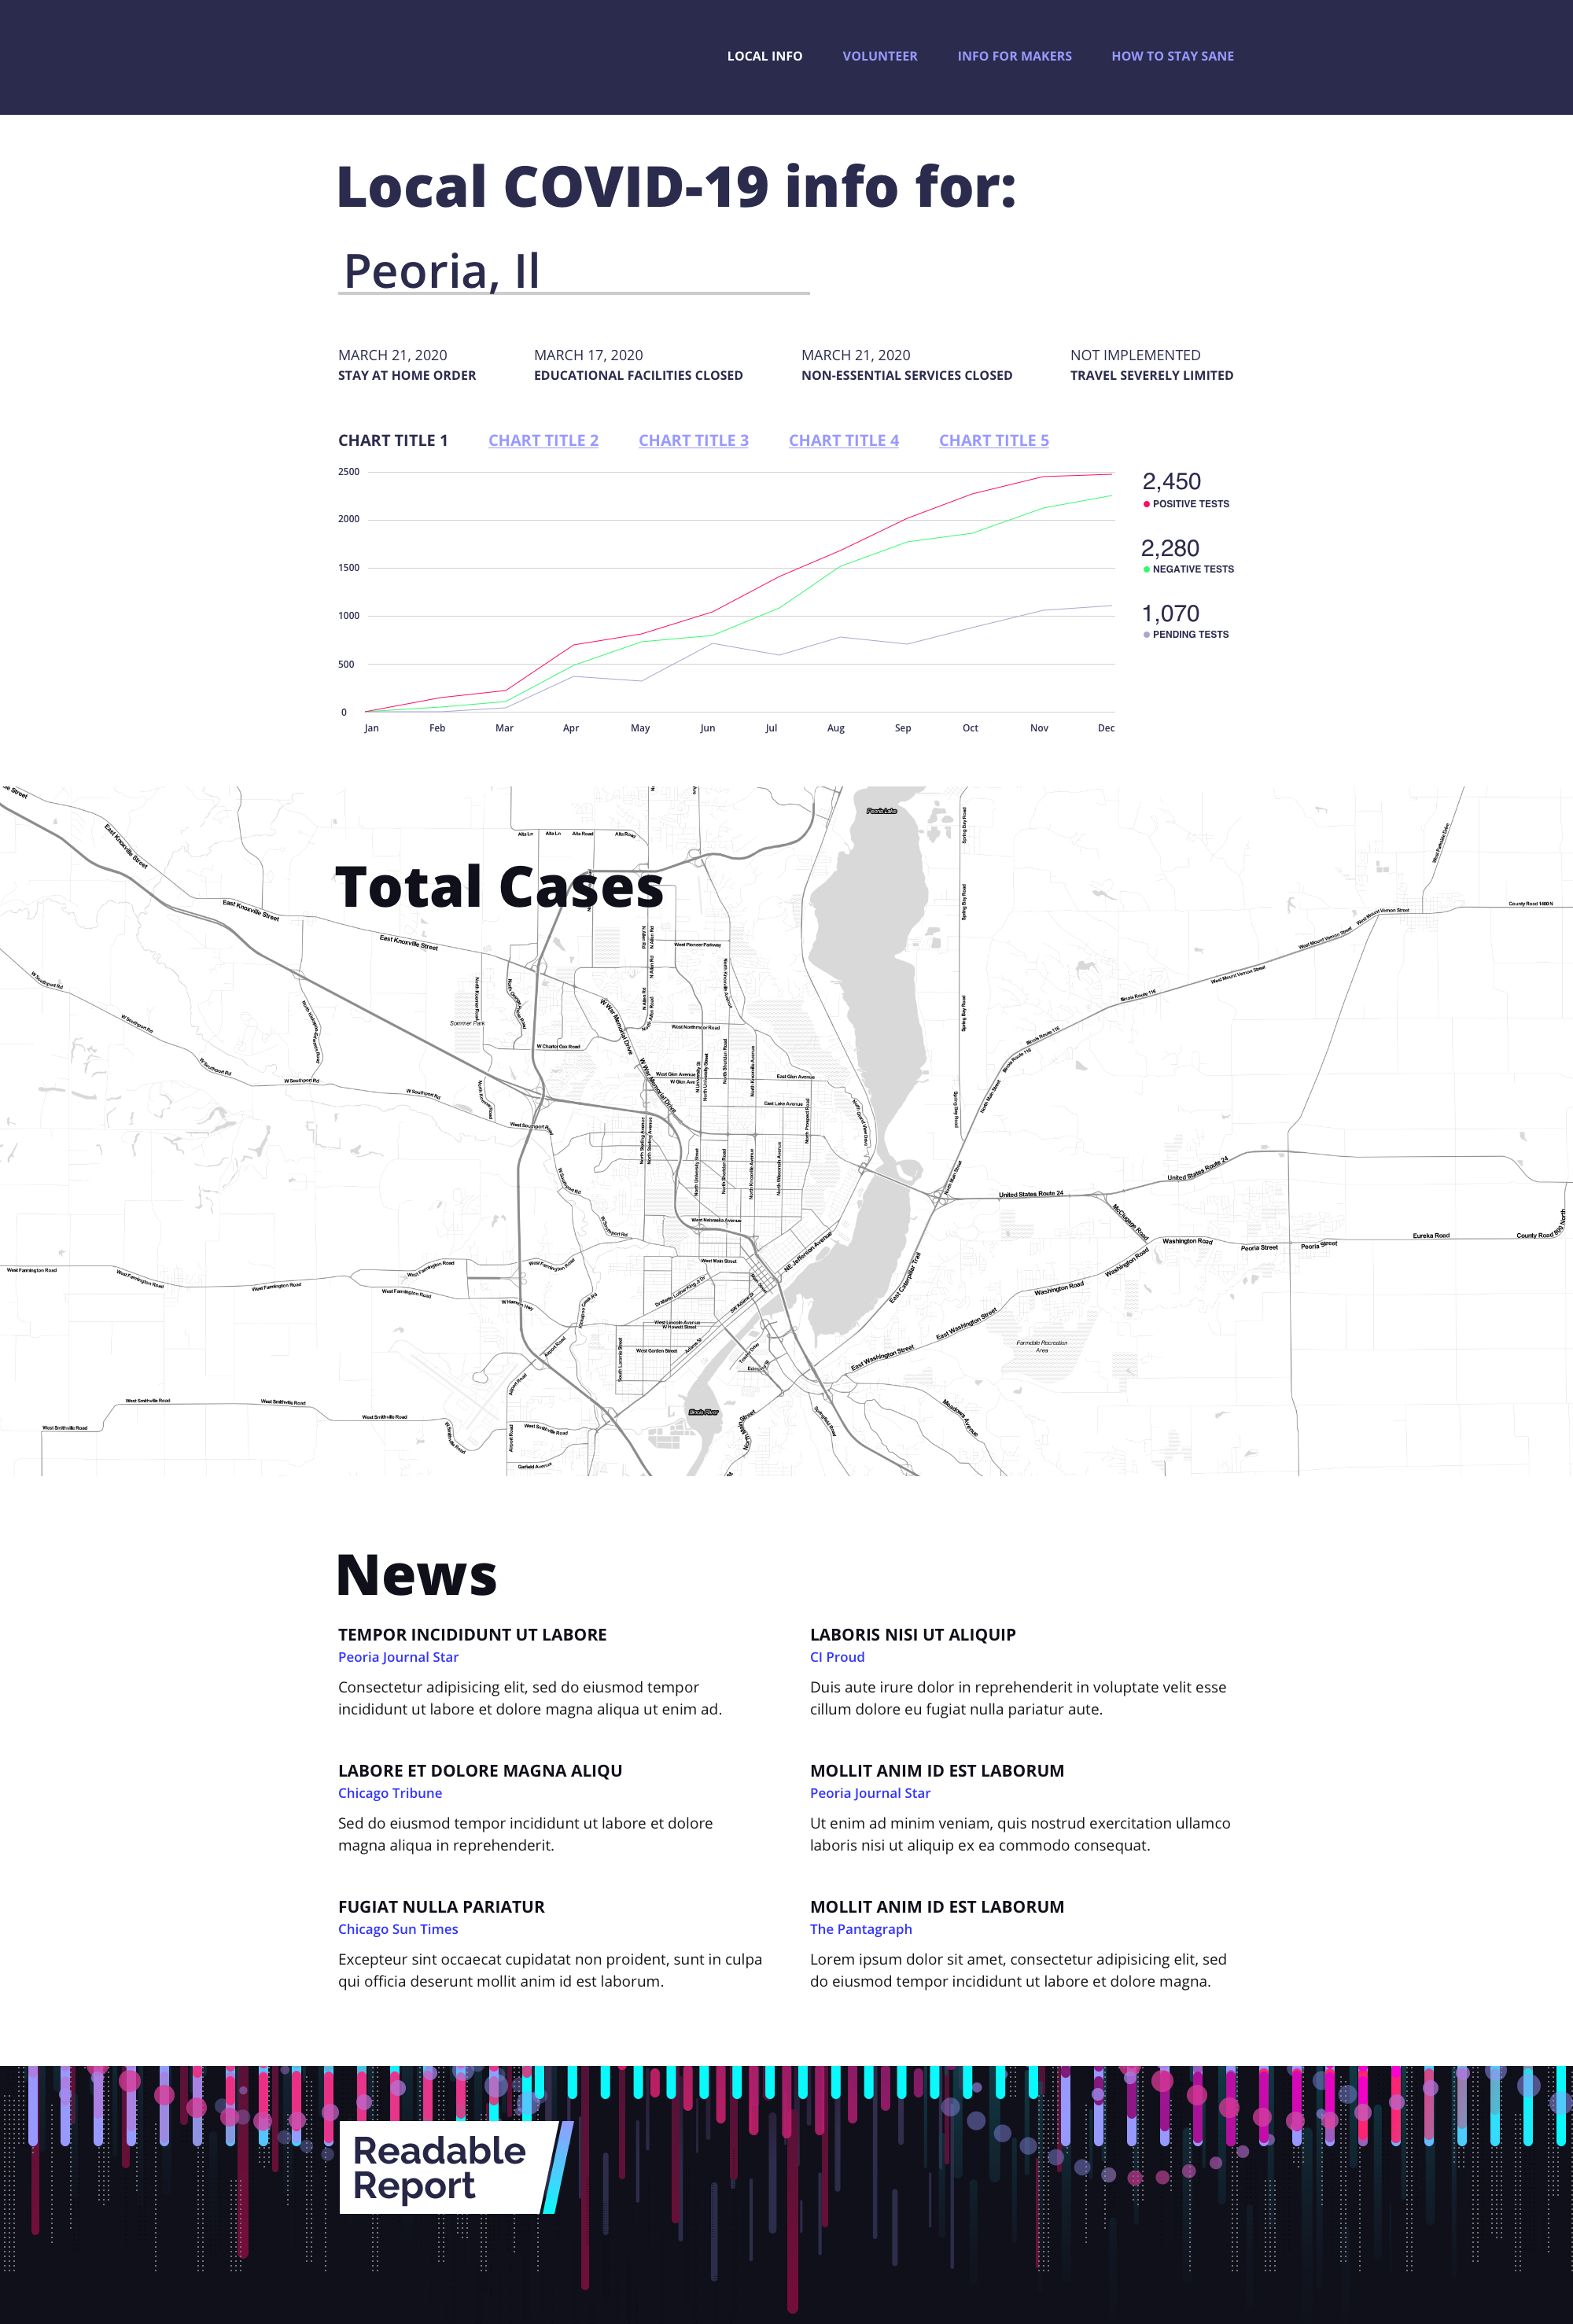
A user would be able to see the national, state, and county stats as well as a trending chart and related local news stories.
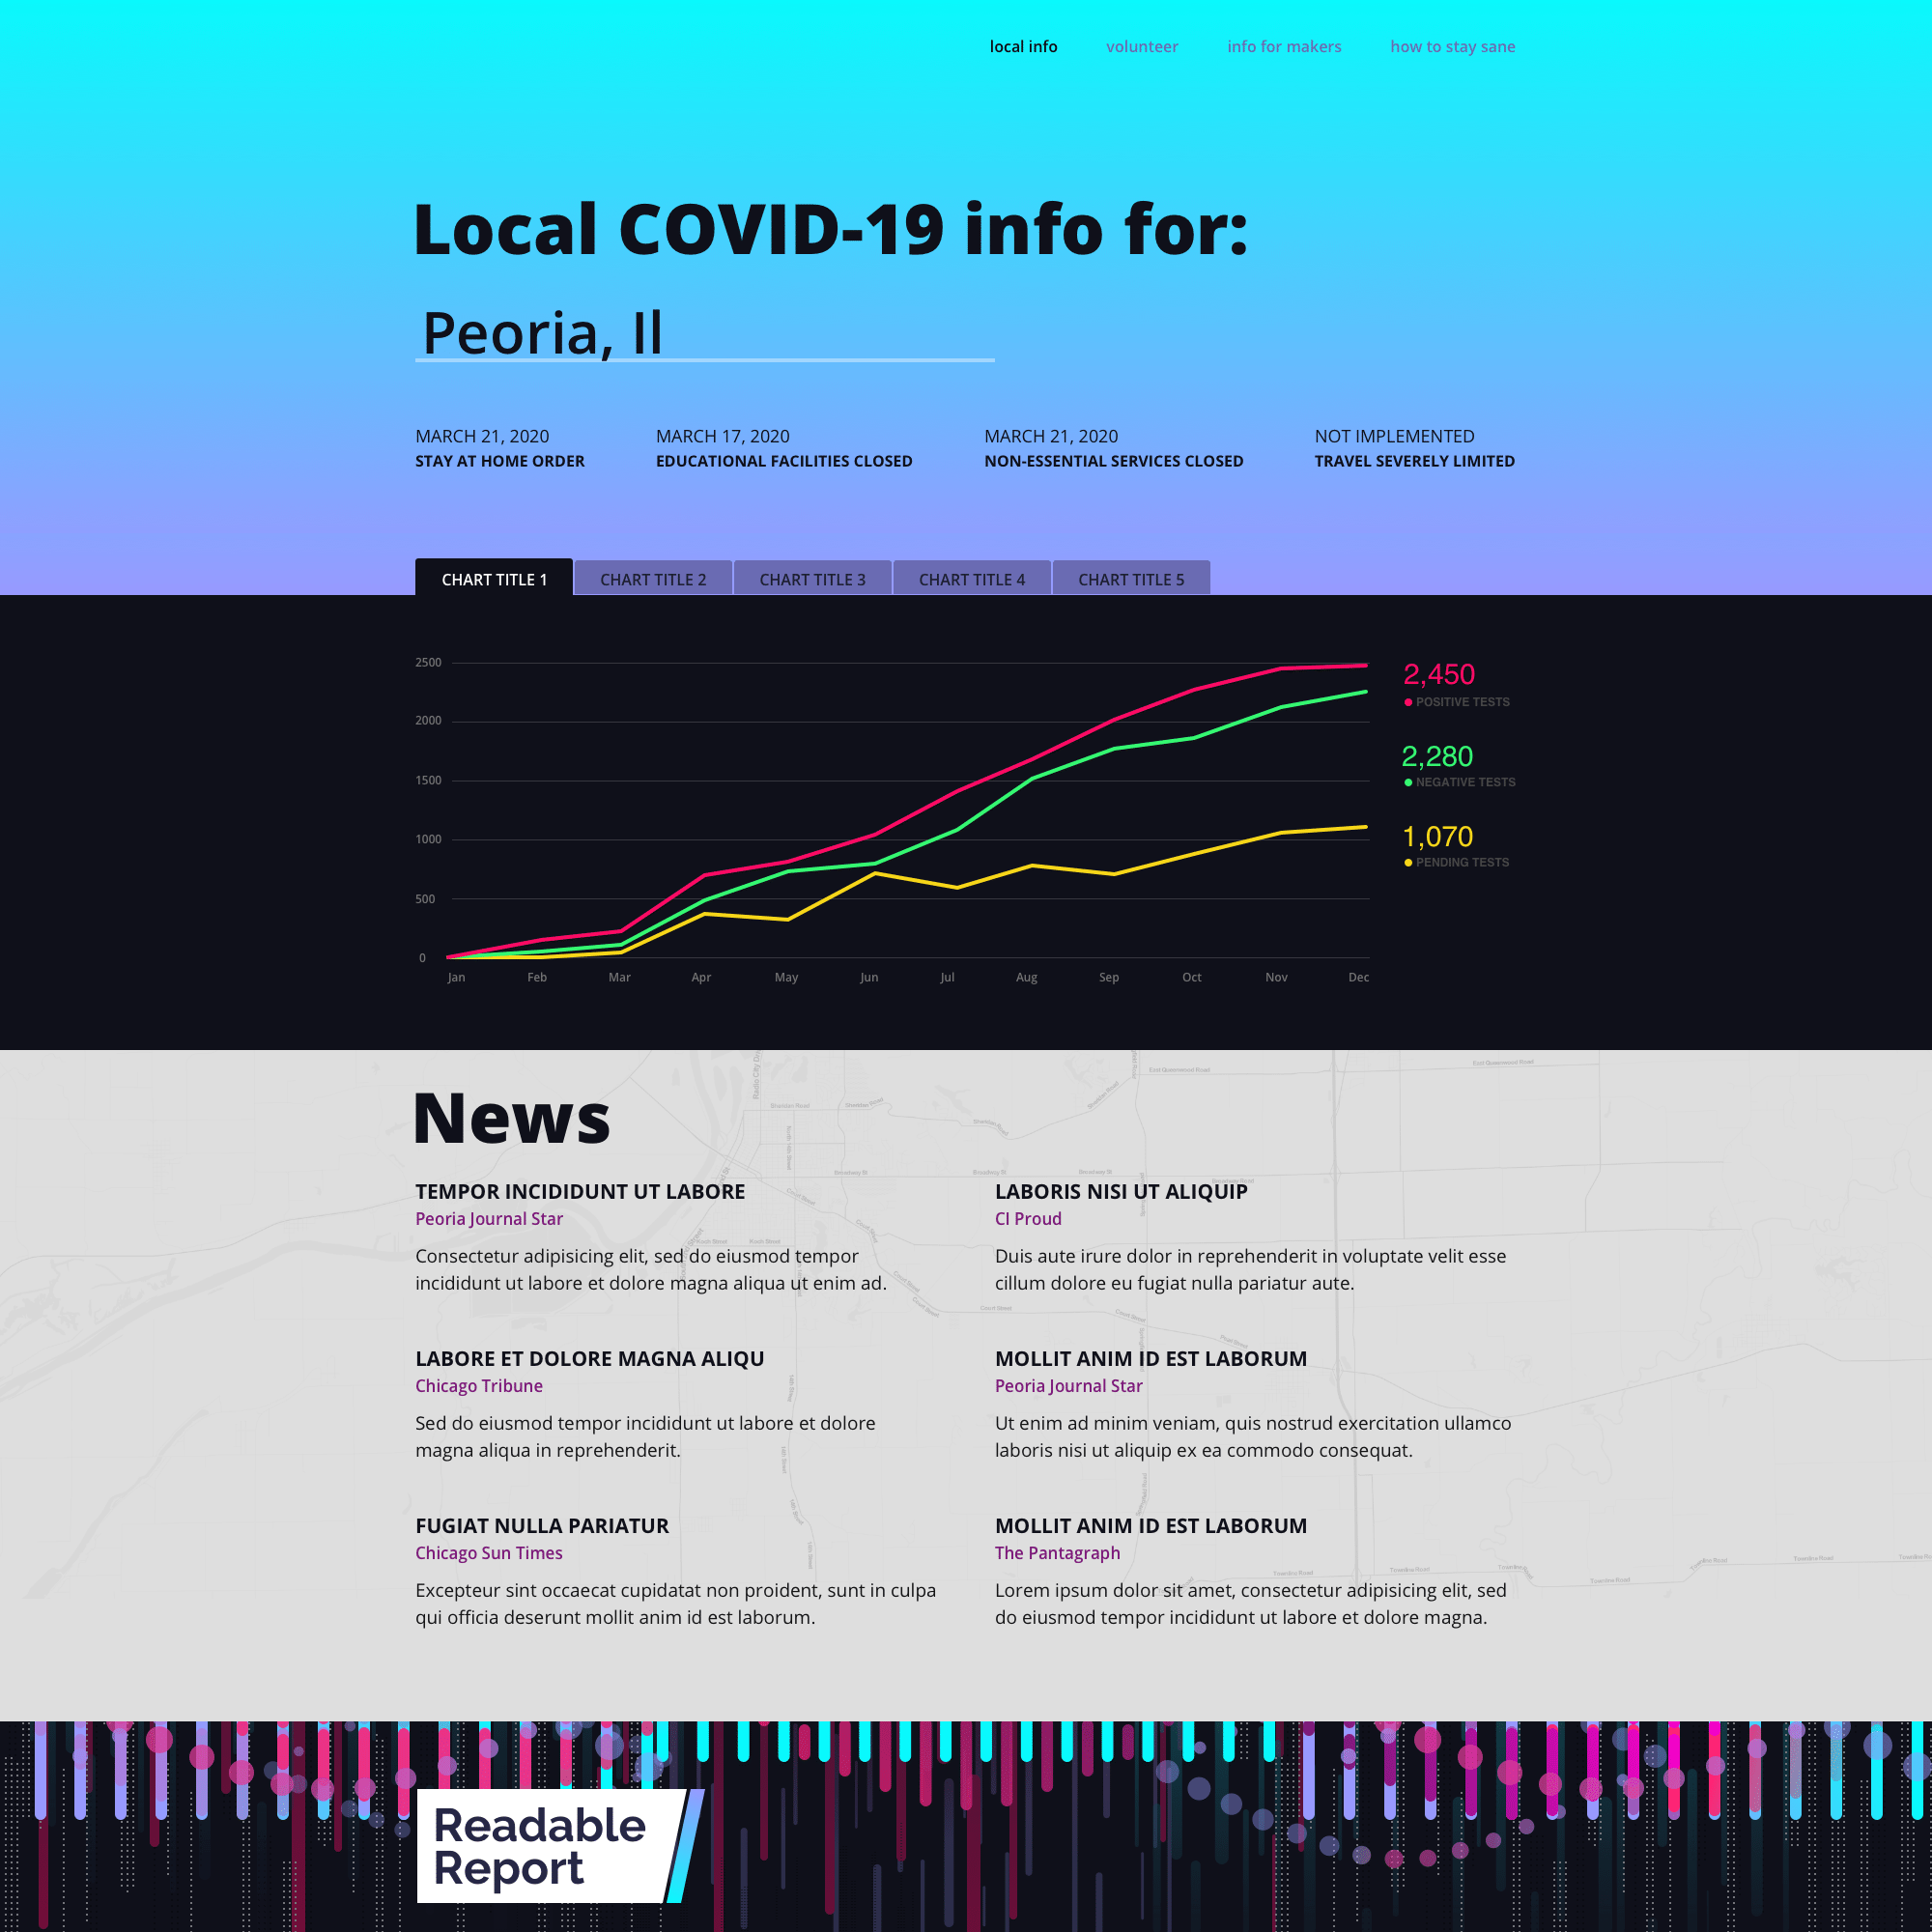
FINAL DESIGN AND LAYOUT
The final frontend was designed and built in VueJS and Tailwind. While the associated graphics were drawn in Sketch.
REVIEW
Utilizing the technology we developed for Readable Report made the project possible and was a great way to leverage wonderful resources like Chart.js, Leaflet for the maps, and Algolia for the search.
As a UX designer working with talented developers is always a highlight of the job and Covid Tracker was a prime example.

